vnstat sur Raspberry Pi pour surveiller le trafic réseau
By Pierre-Alain B on Saturday, June 4 2016, 14:58 - Permalink
Nous allons voir ici comment installer vnstat pour surveiller le trafic réseau et afficher une petite page de synthèse sur l'utilisation du trafic. Cela peut-être utile par exemple pour mesurer le trafic traversant une passerelle Raspberry Pi construite tel que raconté ici.
vnstat en ligne de commande
Tout commence avec (e.g. sous Raspbian Jessie) :
apt install vnstat vnstati
Demandons alors à vnstat de créer une base de données du trafic pour l'interface que l'on veut surveiller :
vnstat -i eth0 -u
Désormais, un appel à la commande vnstat affiche en ligne de commande une synthèse sur le trafic réseau :
vnstat -u #Mise à jour des informations
vnstat #Affichage de la synthèse
Database updated: Sat Jun  4 13:02:00 2016

   eth0 since 29/05/16

          rx:  136.26 MiB      tx:  411.92 MiB      total:  548.18 MiB

   monthly
                     rx      |     tx      |    total    |   avg. rate
     ------------------------+-------------+-------------+---------------
       May '16    134.72 MiB |  410.23 MiB |  544.94 MiB |    1.67 kbit/s
       Jun '16      1.55 MiB |    1.69 MiB |    3.24 MiB |    0.09 kbit/s
     ------------------------+-------------+-------------+---------------
     estimated         8 MiB |       8 MiB |      16 MiB |

   daily
                     rx      |     tx      |    total    |   avg. rate
     ------------------------+-------------+-------------+---------------
      29/05/16    134.72 MiB |  410.23 MiB |  544.94 MiB |   51.67 kbit/s
         today      1.55 MiB |    1.69 MiB |    3.24 MiB |    0.57 kbit/s
     ------------------------+-------------+-------------+---------------
     estimated         1 MiB |       1 MiB |       2 MiB |
vnstat sur une page web
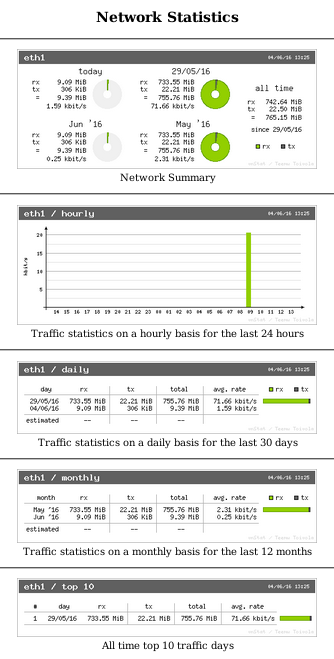
vnstati est une commande parente de vnstat qui génère une image de synthèse plutôt qu'un tableau. Pratique pour nous, êtres humains, qui aimons la bigarrure ! Alors demandons à vnstati de nous géréner quelques images à l'aide de ce script que l'on pourra placer dans cron :
#!/bin/bash
vnstat -u -i eth0
vnstati -s -i eth0 -o /var/www/html/summary.png
vnstati -h -i eth0 -o /var/www/html/hourly.png
vnstati -d -i eth0 -o /var/www/html/daily.png
vnstati -t -i eth0 -o /var/www/html/top10.png
vnstati -m -i eth0 -o /var/www/html/monthly.png
Et pour afficher ces images, nous allons utiliser une petite page web et nginx :
apt install nginx
puis remplaçons la page par défaut /var/www/html/index.nginx-debian.html par index.html contenant :
<!doctype html>
<html>
<head>
<meta charset="utf-8">
<title>Statistics</title>
</head>

<body>
<h2 align="center">Network Statistics</h2>
<hr align="center">
<p align="center"><img src="summary.png" alt="Summary"/><br/>
  Summary
</p>
<hr align="center">
<p align="center"><img src="hourly.png" alt="Traffic stats on a hourly basis for the last 24 hours "/><br/>
  Traffic stats on a hourly basis for the last 24 hours
</p>
<hr align="center">
<p align="center"><img src="daily.png" alt="Traffic stats on a daily basis for the last 30 days"/><br/>
  Traffic stats on a daily basis for the last 30 days
</p>
<hr align="center">
<p align="center"><img src="monthly.png" alt="Traffic stats on a monthly basis for the last 12 months"/><br/>
  Traffic stats on a monthly basis for the last 12 months
</p>
<hr align="center">
<p align="center"></p>
<p align="center"><img src="top10.png" alt="All time top 10 traffic days"/><br/>
  All time top 10 traffic days</p>
<hr align="center">
</body>
</html>
et si l'on pointe un navigateur vers l'adresse IP du Raspberry Pi, on voit alors s'afficher :
